Business question
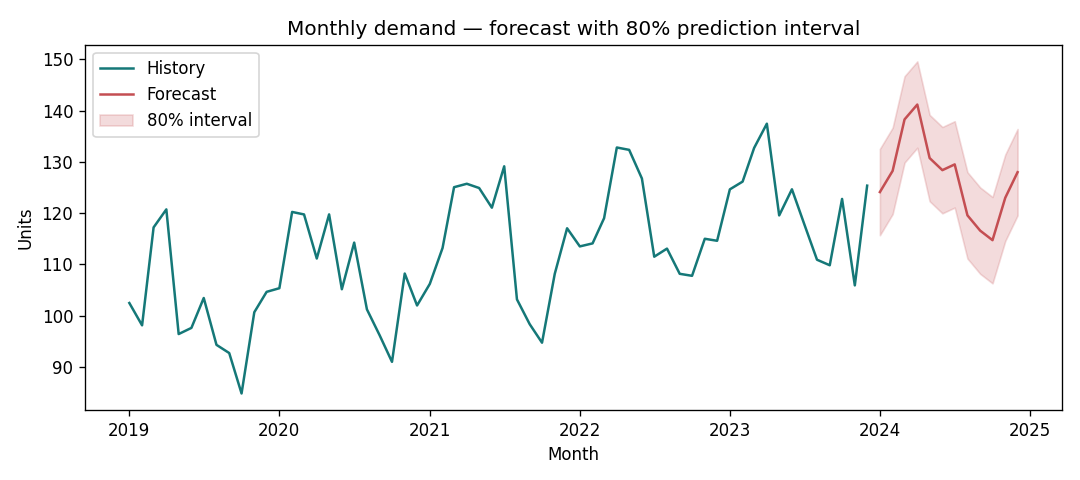
How much should we plan to stock next month, and how wide is the plausible range given historical demand?
What we would decide with this
Use the point forecast for baseline planning and the interval to set safety stock or contingency—explicitly trading off service level against holding cost (not computed here; the chart makes the range visible).
Synthetic data
Monthly demand is simulated with a gentle trend, seasonal pattern, and Gaussian noise. Seed: 42 (see demos/forecasting-uncertainty/data/generate.py). Not real sales data.
Approach
Additive exponential smoothing state-space model (ETS: error, trend, and seasonality all additive) via statsmodels.tsa.exponential_smoothing.ets.ETSModel; 80% prediction interval for the next 12 months.
Key outputs
Reproduce
cd demos/forecasting-uncertainty
python3 data/generate.py
python3 src/run.py
Plots are written to outputs/. Python dependencies: see demos/requirements.txt.