Scientific question
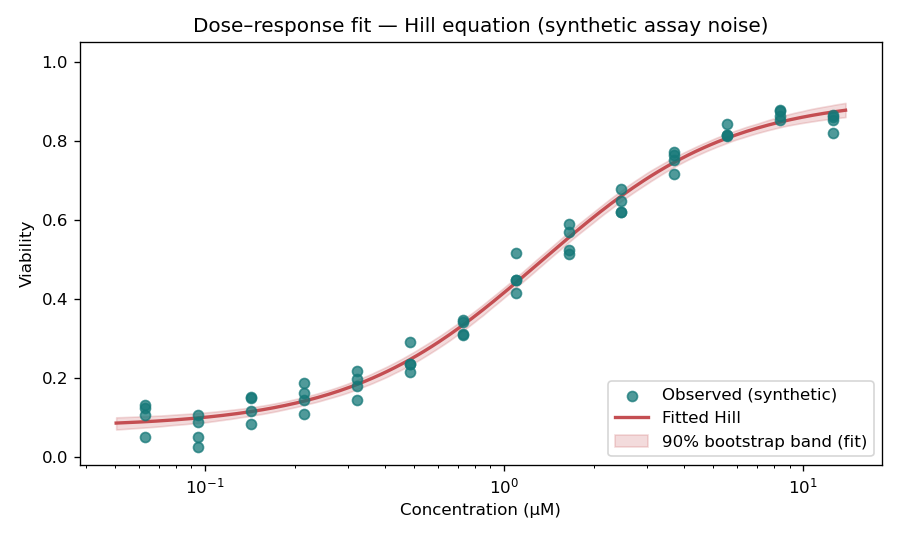
What potency (e.g. EC50) best explains observed viability across concentrations, and how uncertain is the curve?
What we would conclude with this
A well-identified Hill fit supports ranking compounds and comparing potency; the band communicates experimental + fit variability at a glance.
Synthetic data
Log-spaced concentrations with four technical replicates; response follows a Hill equation plus Gaussian noise. See demos/scientific-predictive-dose-response/data/generate.py.
Approach
Nonlinear least squares (scipy.optimize.curve_fit); residual bootstrap on the fitted mean to shade a 90% band on the curve.
Key outputs
Reproduce
cd demos/scientific-predictive-dose-response
python3 data/generate.py
python3 src/run.py
Dependencies: demos/requirements.txt.