Scientific question
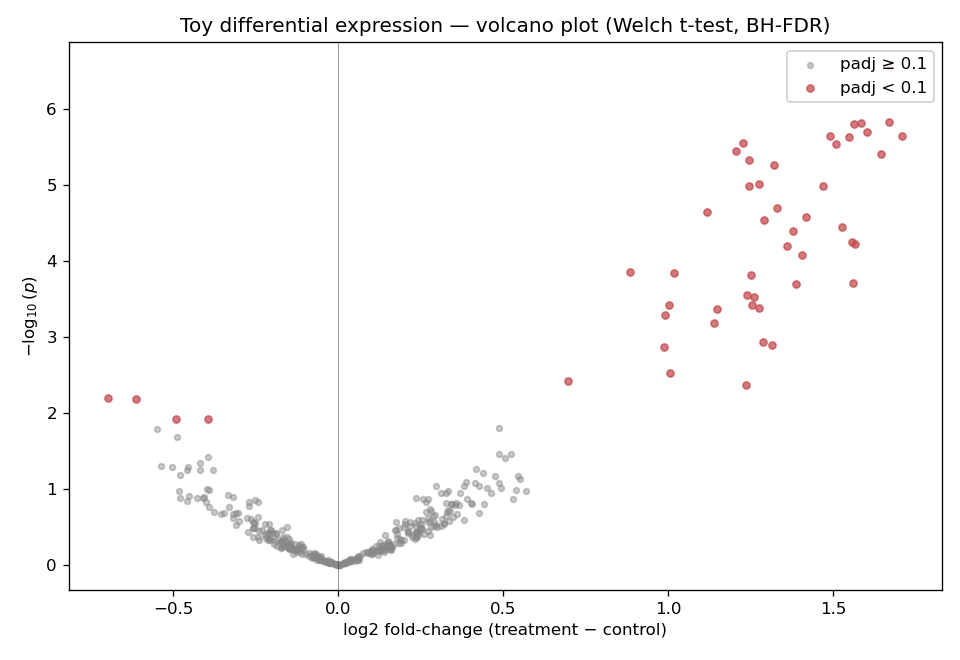
Which features look differentially abundant between treatment and control when we control false discoveries across many parallel tests?
What we would conclude with this
Genes with small adjusted p-values (FDR) and consistent direction support follow-up validation. The volcano plot combines effect size and statistical evidence in one view.
Synthetic data
400 synthetic genes, 10 biological replicates per group; a subset carries a fixed log2 shift. Seed: 42. See demos/scientific-bioinformatics-de/data/generate.py.
Approach
Per-gene Welch t-test; Benjamini–Hochberg adjustment via statsmodels.stats.multitest.multipletests.
Key outputs
Reproduce
cd demos/scientific-bioinformatics-de
python3 data/generate.py
python3 src/run.py
Dependencies: demos/requirements.txt.