Business question
How do we summarize support load when each ticket mixes free text, structured fields (product, channel), and numeric signals (attachments)?
What we would decide with this
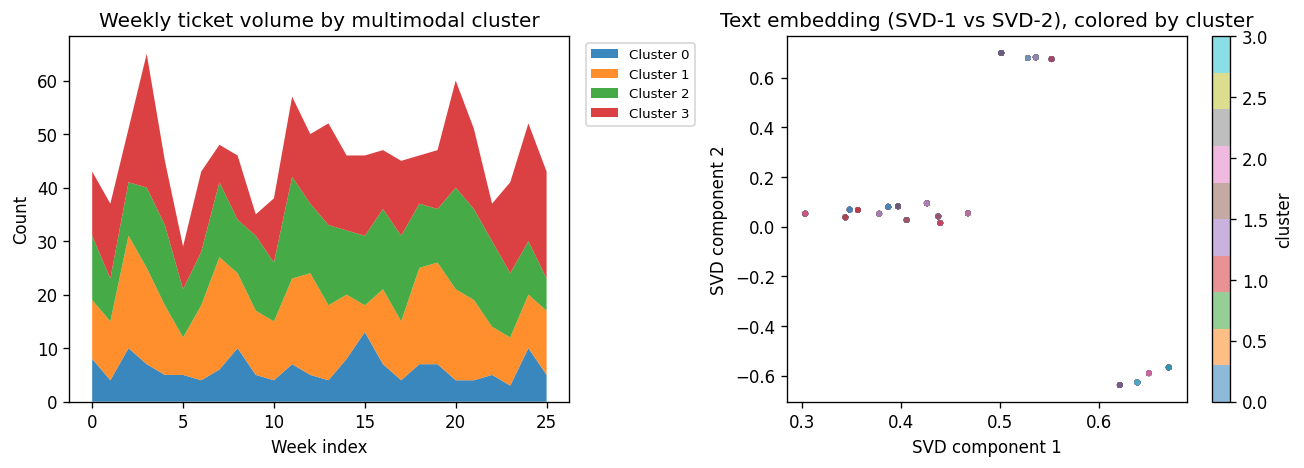
Use a joint cluster view to spot recurring multimodal patterns, then track how cluster mix shifts by week to prioritize engineering, docs, or ops—without treating text and tabular data in isolation.
Synthetic data
Rows are synthetic support tickets with subject, body, product_line, channel, attachment_kb, week_index, and a hidden theme label for grounding. Seed: 42. See demos/multimodal-support-signals/data/generate.py.
Approach
- Text: TF–IDF on subject + body, reduced with TruncatedSVD (dense).
- Tabular: One-hot encoding for product line and channel; scale attachment size.
- Fusion: Concatenate text SVD features with tabular features; k-means (k=4).
- Time: Stacked area of weekly counts per cluster; scatter of first two SVD dimensions colored by cluster.
Key outputs
Reproduce
cd demos/multimodal-support-signals
python3 data/generate.py
python3 src/run.py
Dependencies: demos/requirements.txt.